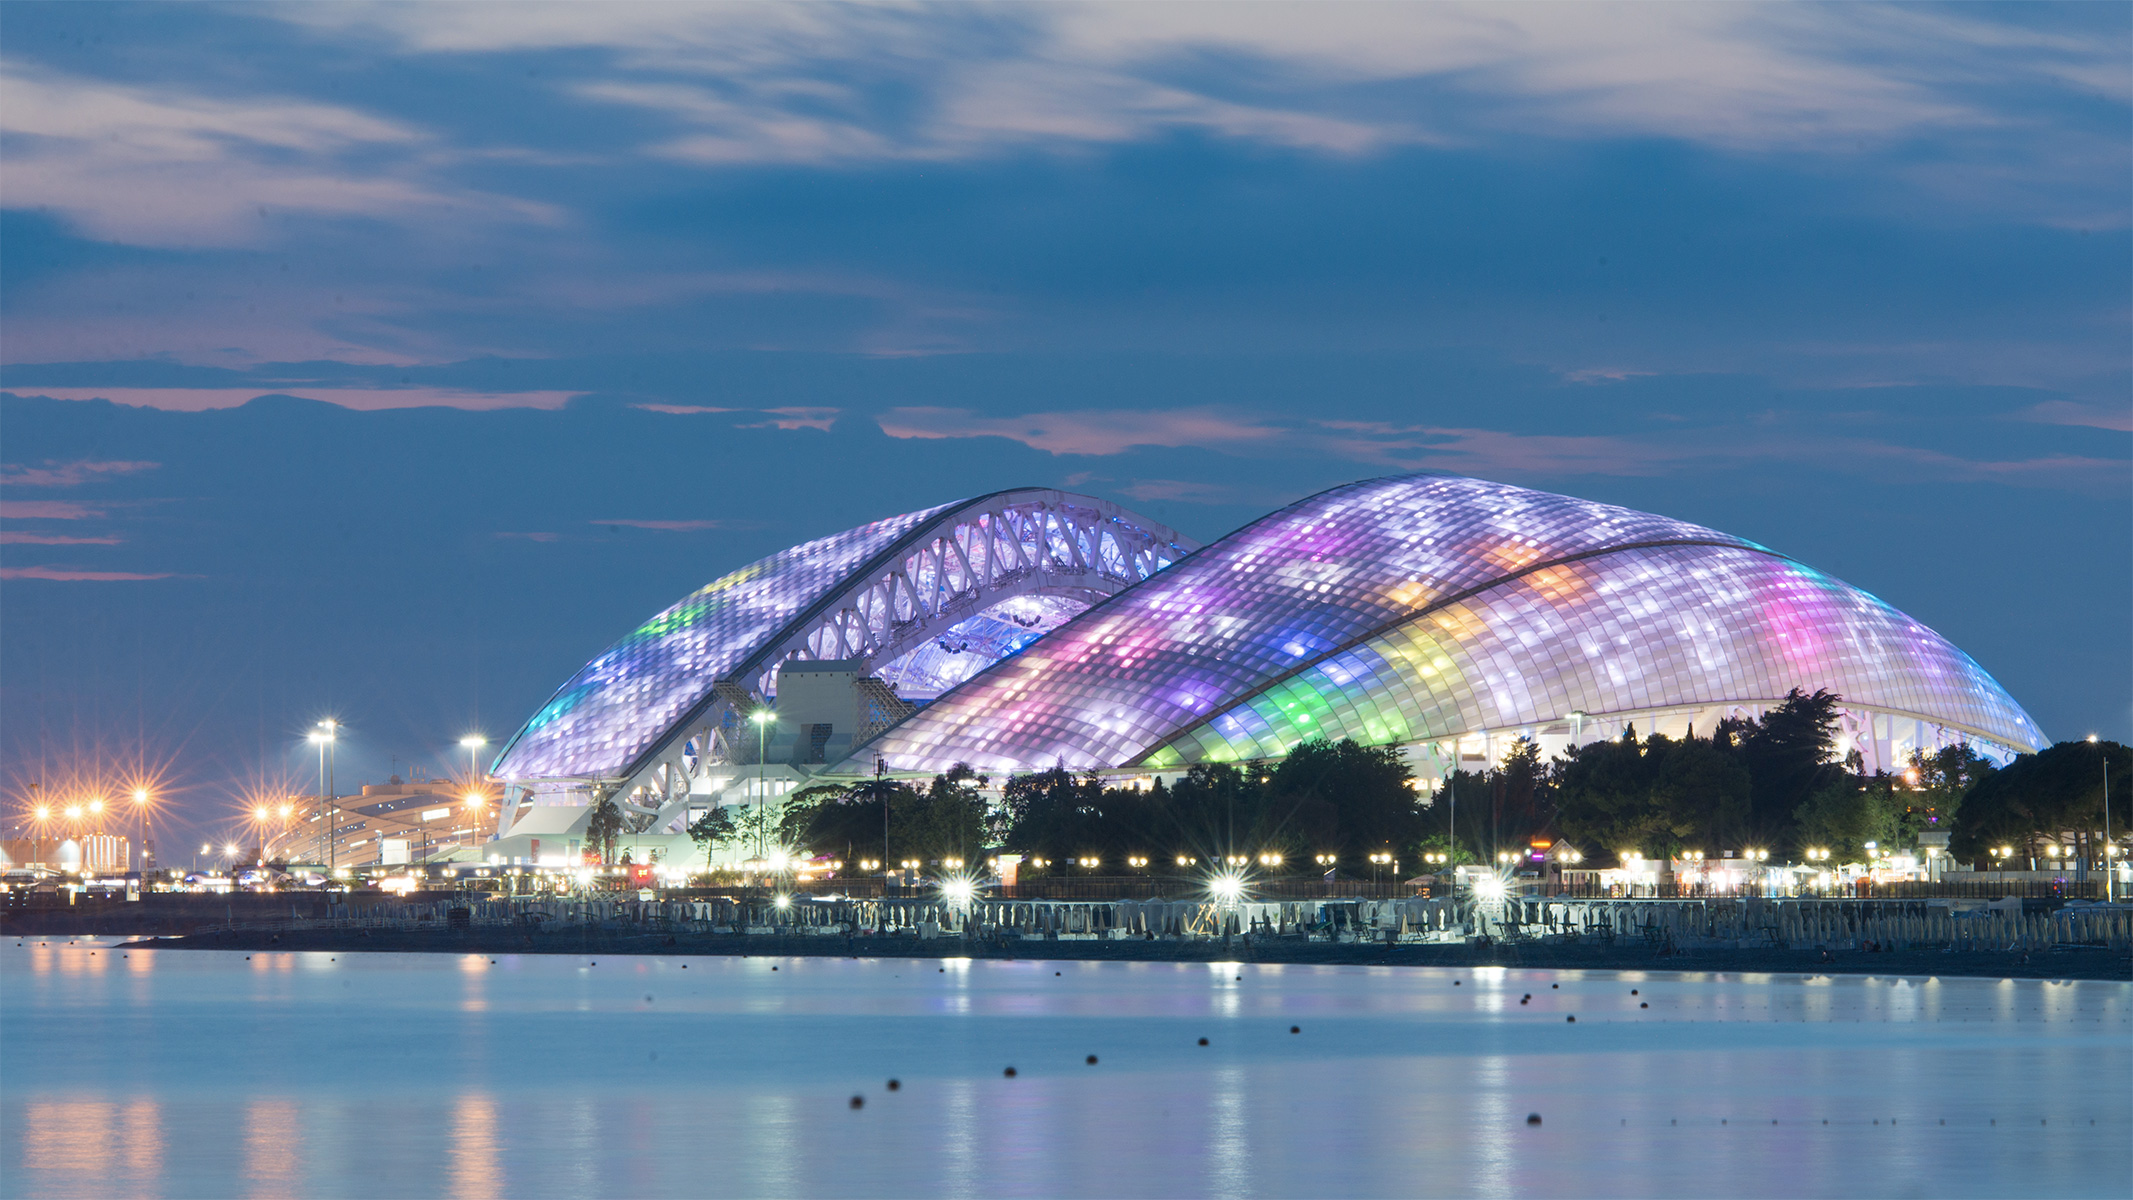
Фото: fisht.info
Project Periods:
First phase (Olympic and Paralympic games) — from 2010 until 2013
Second phase (FIFA Confederations cup/World Cup 2018) — from 2014 until 2016
Third phase (after FIFA Confederations cup/World Cup 2018 ) — summer 2018 and onwards
Objective:
To provide and install tools for structural health monitoring
To provide an instrument for a successful building maintenance and its management at any point in time
To provide an instrument to prevent any possible possible structural collapse in case of emergencies
Main challenge:
To provide solutions, that will not only allow to complete the objective, but will also make a transition between the phases as easy as possible
Project Summary Instrumentation:
16 biaxial of tiltmeters Gorizont
80 strain gauges Sisgeo
16 of accelerometers GeoSig
2 of total stations Leica Geosystems TM 30 0.5”
116 reflectors Leica GMP-104
Fisht Olympic stadium was going to face 3 main phases to make a number of changes in the stadium’s construction.
Fisht Olympic stadium near the end of the 2nd construction stage
These stage are:
Phase 1. Sochi 2014 Olympic and Paralympic Games period
The stadium construction has begun in 2010 and has been finished in 2013. The result of the construction was the 40000 indoor stadium that has served as a venue for the opening and closing ceremonies for the Sochi 2014 Olympic and Paralympics games.
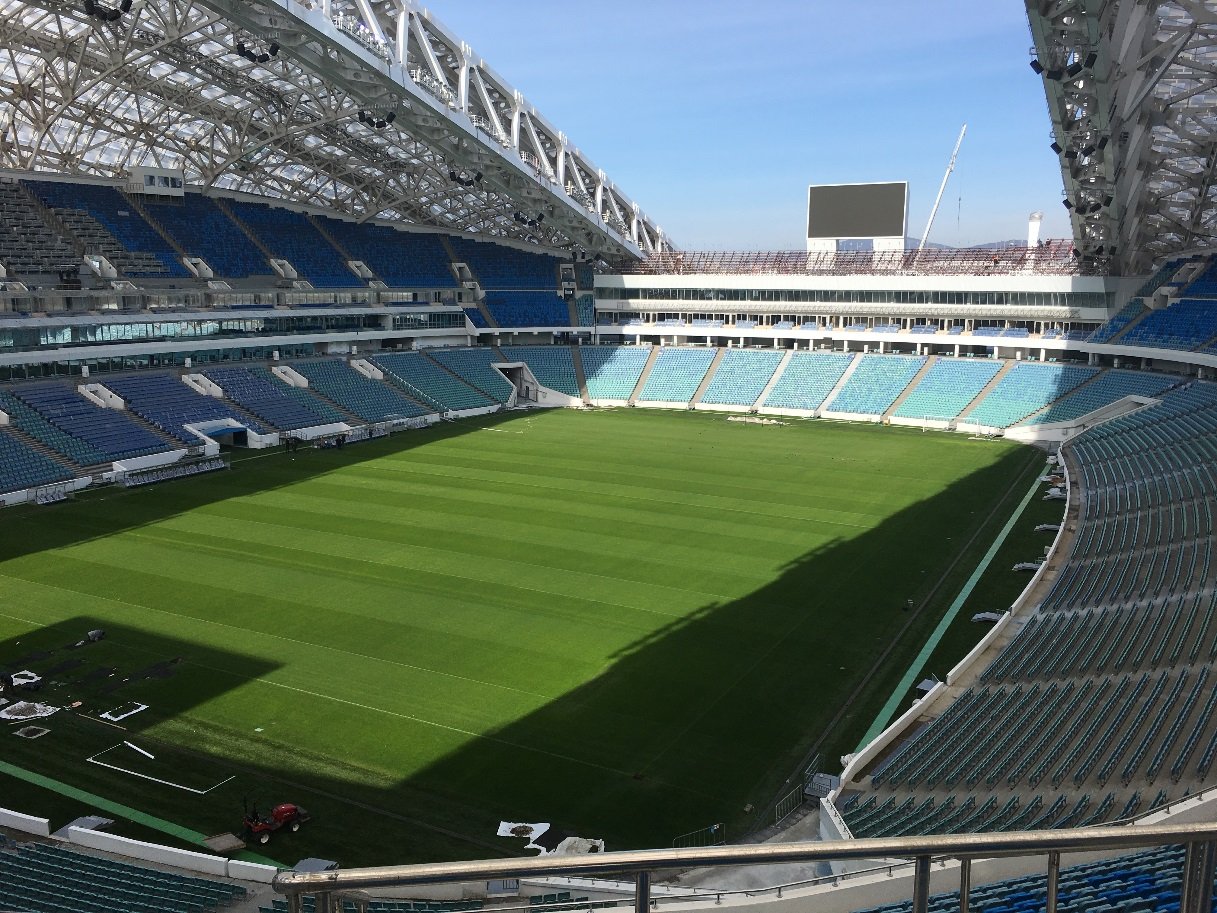
Phase 2. FIFA Confederations cup 2017 and FIFA World Cup 2018
Prior the FIFA Confederations cup 2017 and FIFA World Cup 2018 the stadium has been closed for the reconstruction. It has been reopened in 2016 as an open-air football stadium, to host football matches. The main change that has been made is the transformation of the stadium from the enclosed facility into an outdoor space, that increased the stadium capacity up to 48000.
Phase 3. After FIFA events
After the FIFA events the stadium is going to be reduced in size and become a home arena for the FC “Sochi”.
Fisht Olympic stadium was designed as one of the main sporting facilities for the major international sport events — Olympic/Paralympic games and FIFA Confederations cup 2017 and FIFA World Cup 2018. Therefore, the project faces 3 main stages: an indoor facility with the capacity of 40000 for Sochi 2014, an outdoor facility with the capacity of 48000 — to host FIFA 2018 World cup, and after all it is planned to be a home stadium for the “Sochi” football club. Overall, all these transformations have set one global task for SODIS Lab: to provide Fisht stadium with the most efficient monitoring tools with regard to all the upcoming changes within the projects.
To complete such a task and provide the best result possible SODIS Lab has decided to implement SODIS Building M solution.
Why was SODIS Building M the best solution for this object?
SODIS Lab provides various products for the building monitoring services, but SODIS Building M can be called a flagship product of our company, as well as among the competitors worldwide. The main reason for this is that SODIS Building M is considered as one of the top products for the building monitoring (3rd level BIM product), because it perfectly fits into the current and upcoming trends of electronic construction and maintenance. In short, SODIS Building M allows to collect all the required data about construction “health” and provide high level of the monitoring construction.
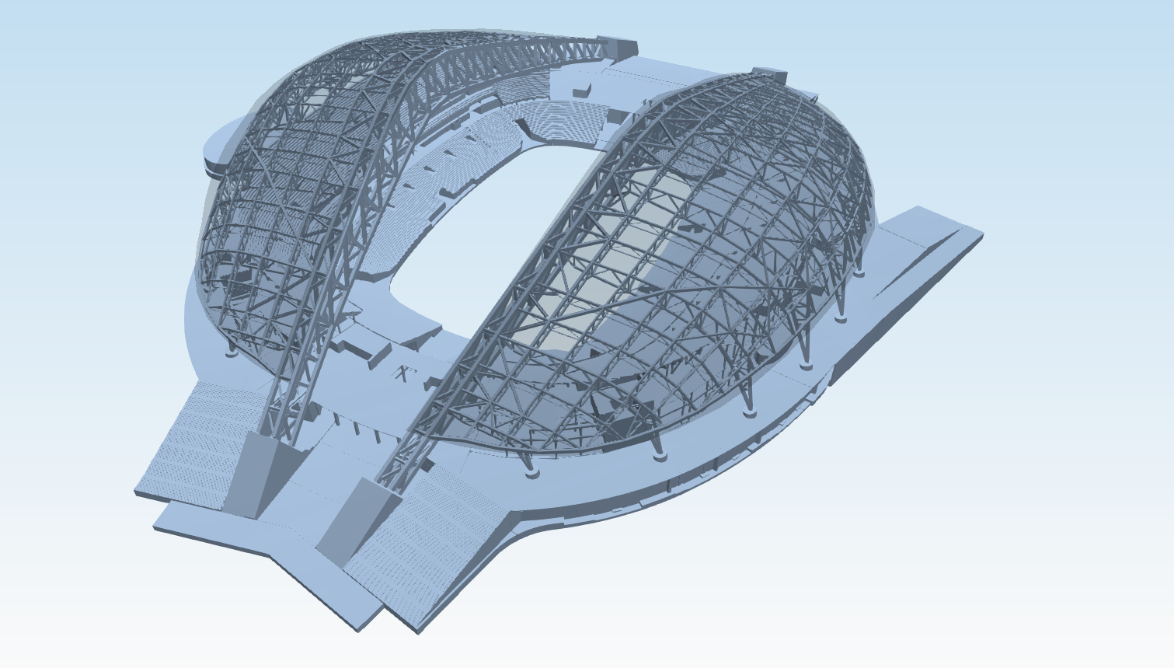
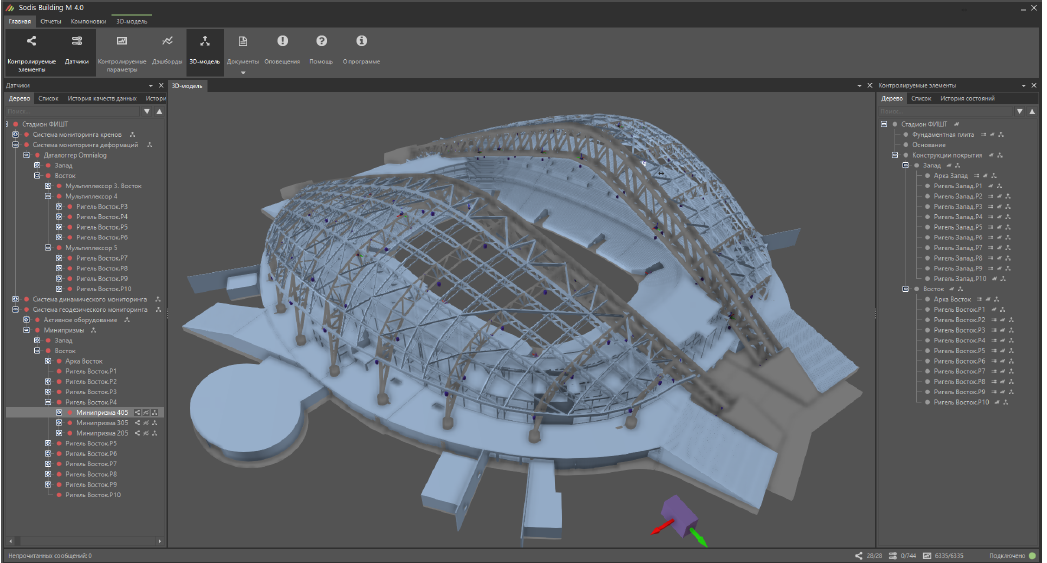
Basic 3D BIM model of the stadium
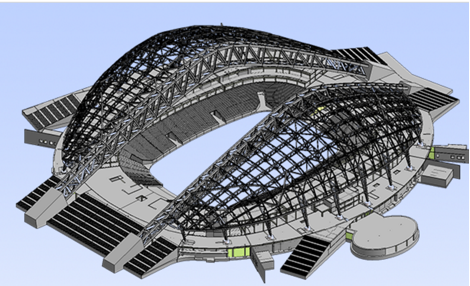
Overall look of the stadium’s BIM model
How has SODIS LAB done the building information modelling of the stadium?
Building monitoring of the Fisht Olympic stadium has begun with the creation of its BIM model. This model was going to be based on the two cores behind the SODIS Building M — first core, which was going to monitor structure and the second one — to evaluate all the collected date. To be able to monitor and collect the data SODIS Lab has installed number of sensors throughout the stadium. These sensors included 16 tiltmeters, 80 strain gauges and 16 accelerometers. In addition, to track the spatial movements of the unique coating of the stadium (mainly of its roof), SODIS Lab has used two high end electronic robotic total stations, produced by Leica: TM 30 0.5”and 116 reflectors. All of these sensors have been installed with SODIS Building M software on them, which allowed achieving the best results possible and collecting all the necessary information regarding the conditions of the stadium during all phases of the structures lifecycle. In addition, Sodis Lab has also used the Leica Geosystems software to help with maintaining of all the sensors.
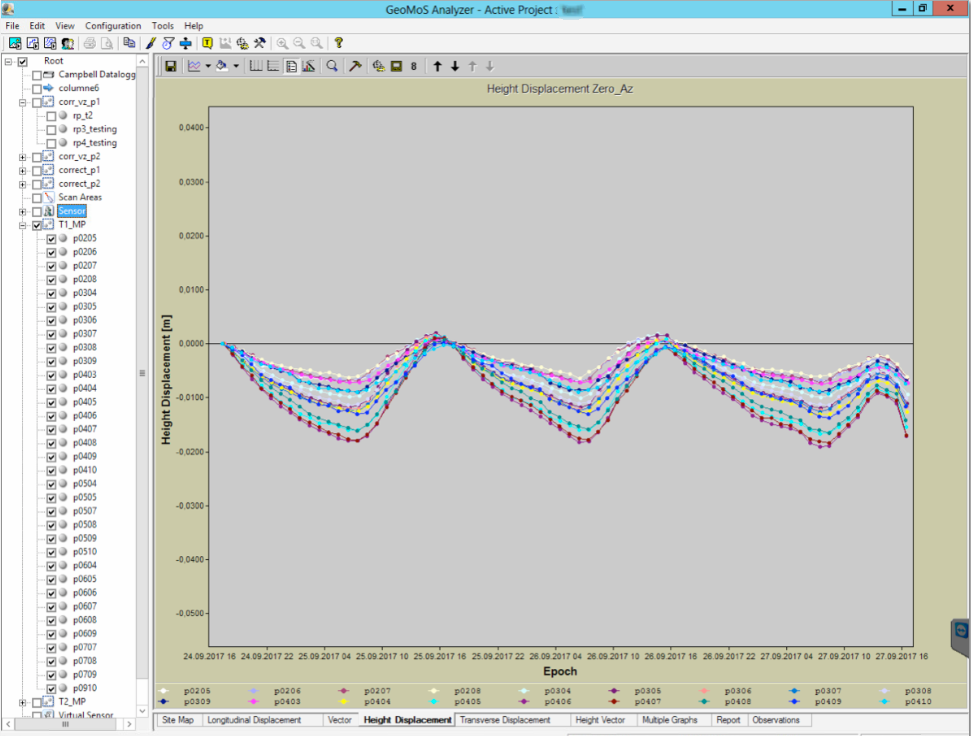
Height displacement data
SODIS Building M Data Acquisition system at work
What benefits does SODIS Building M provide?
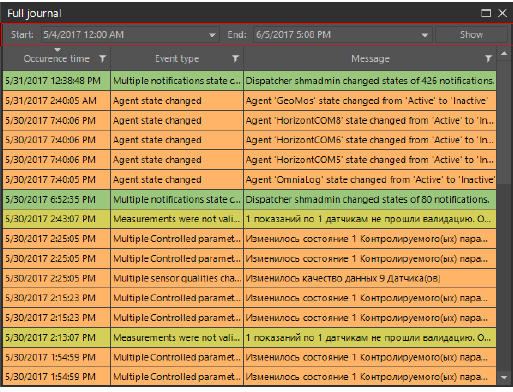
First of all SODIS Building M is a flexible tool, that can work with any type of an equipment. Such flexibility allowed SODIS Lab to choose from many suppliers of the equipment and to end up with the best options for the Fisht Olympic stadium. Furthermore, the system provides a continuous data collection from all the sensors (works in a real time mode) as well as it saves and maintains all the data, which any user can access from anywhere – the only thing, which is required is an access to the internet and login/password combination. In addition, in case of any danger to the construction health, the system will automatically send a signal to the operator, so the user will be able to find a problem as soon as possible and decide on the best way to fix it. Furthermore, due to the specific feature of the SODIS Building M, the software collects the data of not only the object as whole, but also an information regarding each independent element and equipment (e.g., windows, doors, columns, basements etc.) of the stadium.
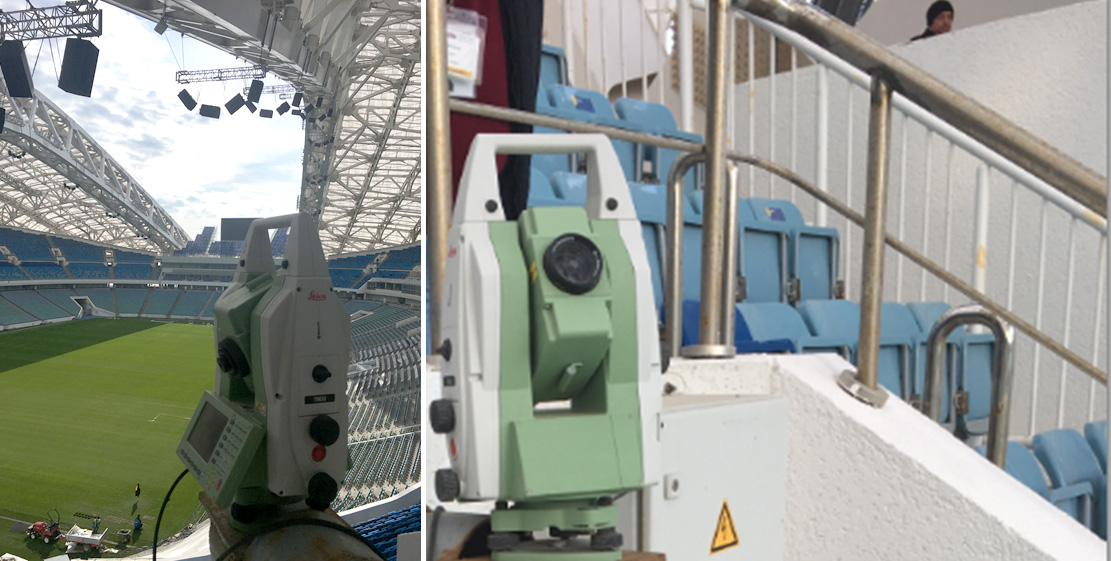
Leica sensors installed on the stadium
Secondly, all the collected data can be viewed in the form of online graphs as well as in the report form, which the system generates automatically.
List of reports that can be accessed from SODIS Building M
Thirdly, SODIS Building M main structure involves six main features, which are connected with each other:
Because of this structure SODIS Building M allows an operator to set up the software the way it is required at each stage of the stadium lifecycle. For example, the algorithms and measured values collected during the Olympic/Paralympic games were different from those at the FIFA events, the flexibility of SODIS Building M allowed to change them, without requiring additional costs and time.
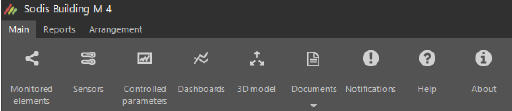
Main panel of SODIS Building M includes an access to the 3 key components of the system: monitored elements, sensors and controlled parameters
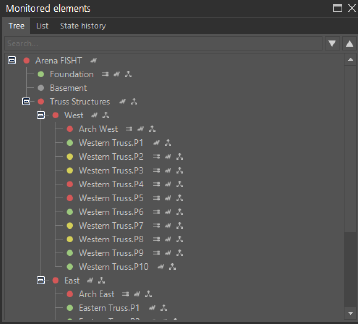
List of monitored elements in SODIS Building M
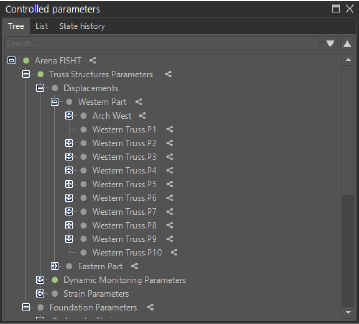
List of controlled parameters in Sodis Building M
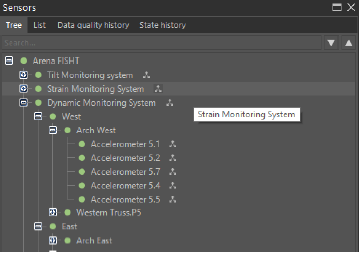
List of sensors in SODIS Building M
Fourth, SODIS Building M allows to process all of data, that can be required by the user. As it has been mentioned before, the equipment provided by SODIS Lab partners allowed the operator of the stadium to collect all the required data. The types of data that can be processed are:
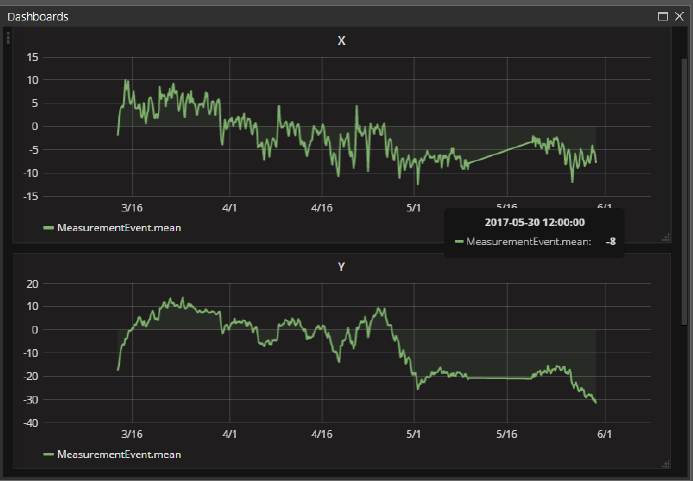
The data analysis collected in the graph form in SODIS Building M
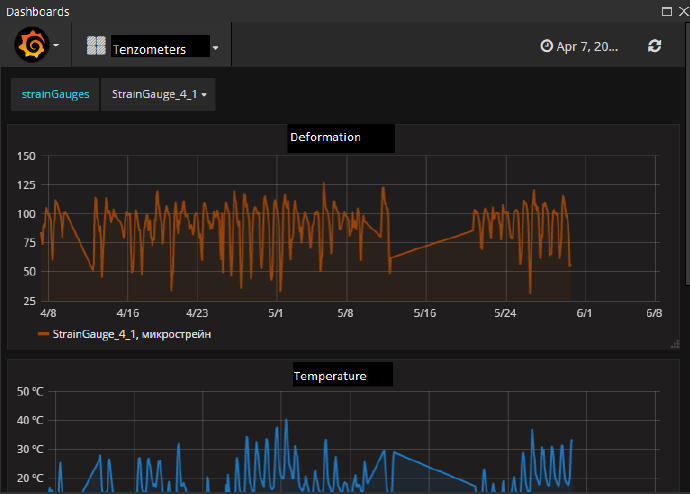
The data analysis collected in the graph form in SODIS Building M
Finally, any user can not only learn how to work in SODIS Building M in shortest time possible, but also to customize the interface of the program, the way he wants it to be.
How did it work in real life?
On the basis of the stadium BIM model SODIS Lab designed the number of sensors required to be installed on the structures for an on-line health monitoring. Furthermore, all of the possible changes in the stadium construction due to its transformation have been taken into account to reduce the costs of the future works. The result of the SODIS Building M implementation was the “full picture” of the structural condition. People that were involved into the process of the stadium construction and transformation were able to use the model to their needs during all of the construction stages. Furthermore even during the process of the stadium construction there hasn’t been a reason for reviewing the safety parameters, due to the work, that has been done during the establishment of BIM model. However, if required, SODIS Building M allows making changes in the model within the shortest possible time. For example, that was a case with a change of the stadium from the indoor to outdoor object.
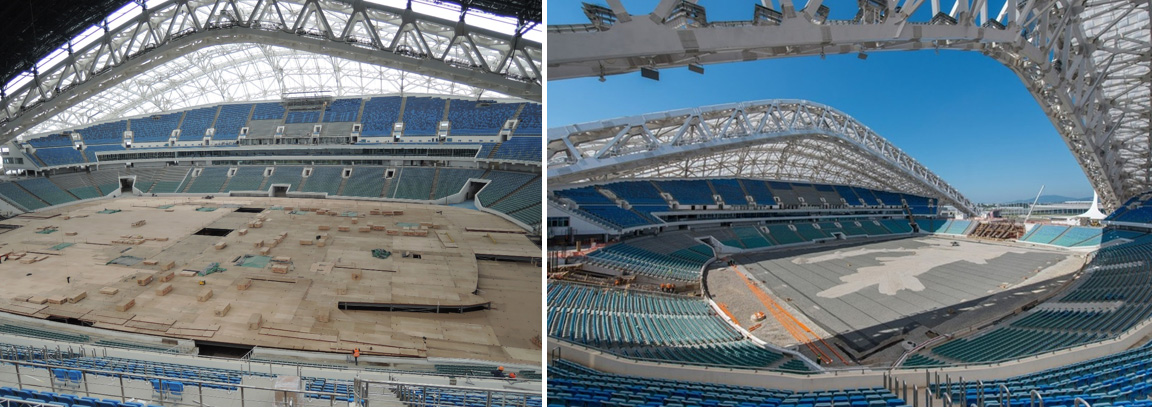
Fisht Olympic stadium with the roof (1st stage of construction) and without it (2nd stage of construction)